Reproducible
Data Science for Ag
Why does it matter?
It is the #1 skill-gap in the job market:
- Academia,
- Industry,
- Government, NGOs, etc.
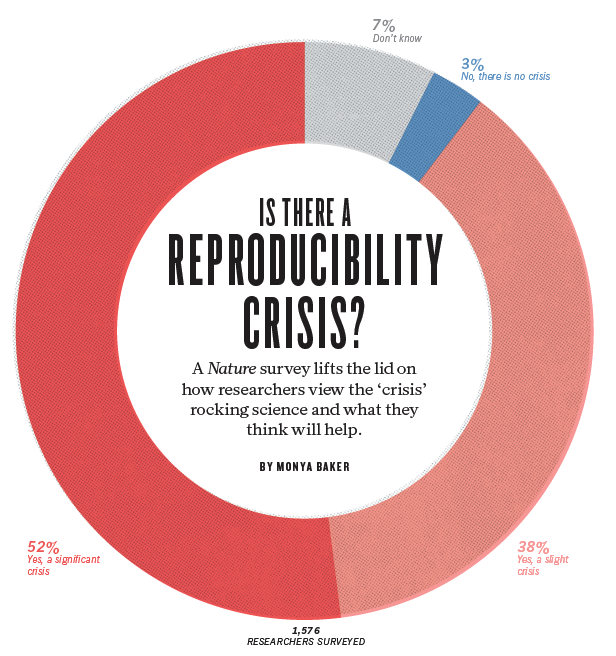
Is there a REPRODUCIBILITY CRISIS in science?
YES
A Nature survey with ~1,600 researchers found that
+70% failure rate to reproduce another scientist’s experiments
+50% have failed to reproduce their own experiments
Main causes: selective reporting, weak stats, code/data unavailability, etc.
Brief History of R 📜
- Origin: Developed in the early 1990s by Ross Ihaka and Robert Gentleman at the University of Auckland, New Zealand.
- Inspiration: R is an implementation of the S language, designed at Bell Laboratories for data analysis.
- Open Source: Released as free, open-source software, leading to a large community of users and contributors.
- Popularity: Today, R is one of the top programming languages for statistical analysis and data science.
- CRAN: the Comprehensive R Archive Network, which hosts thousands of packages was developed in 1997 by Kurt Hornik & Fritz Leisch.

Ihaka, Gentleman
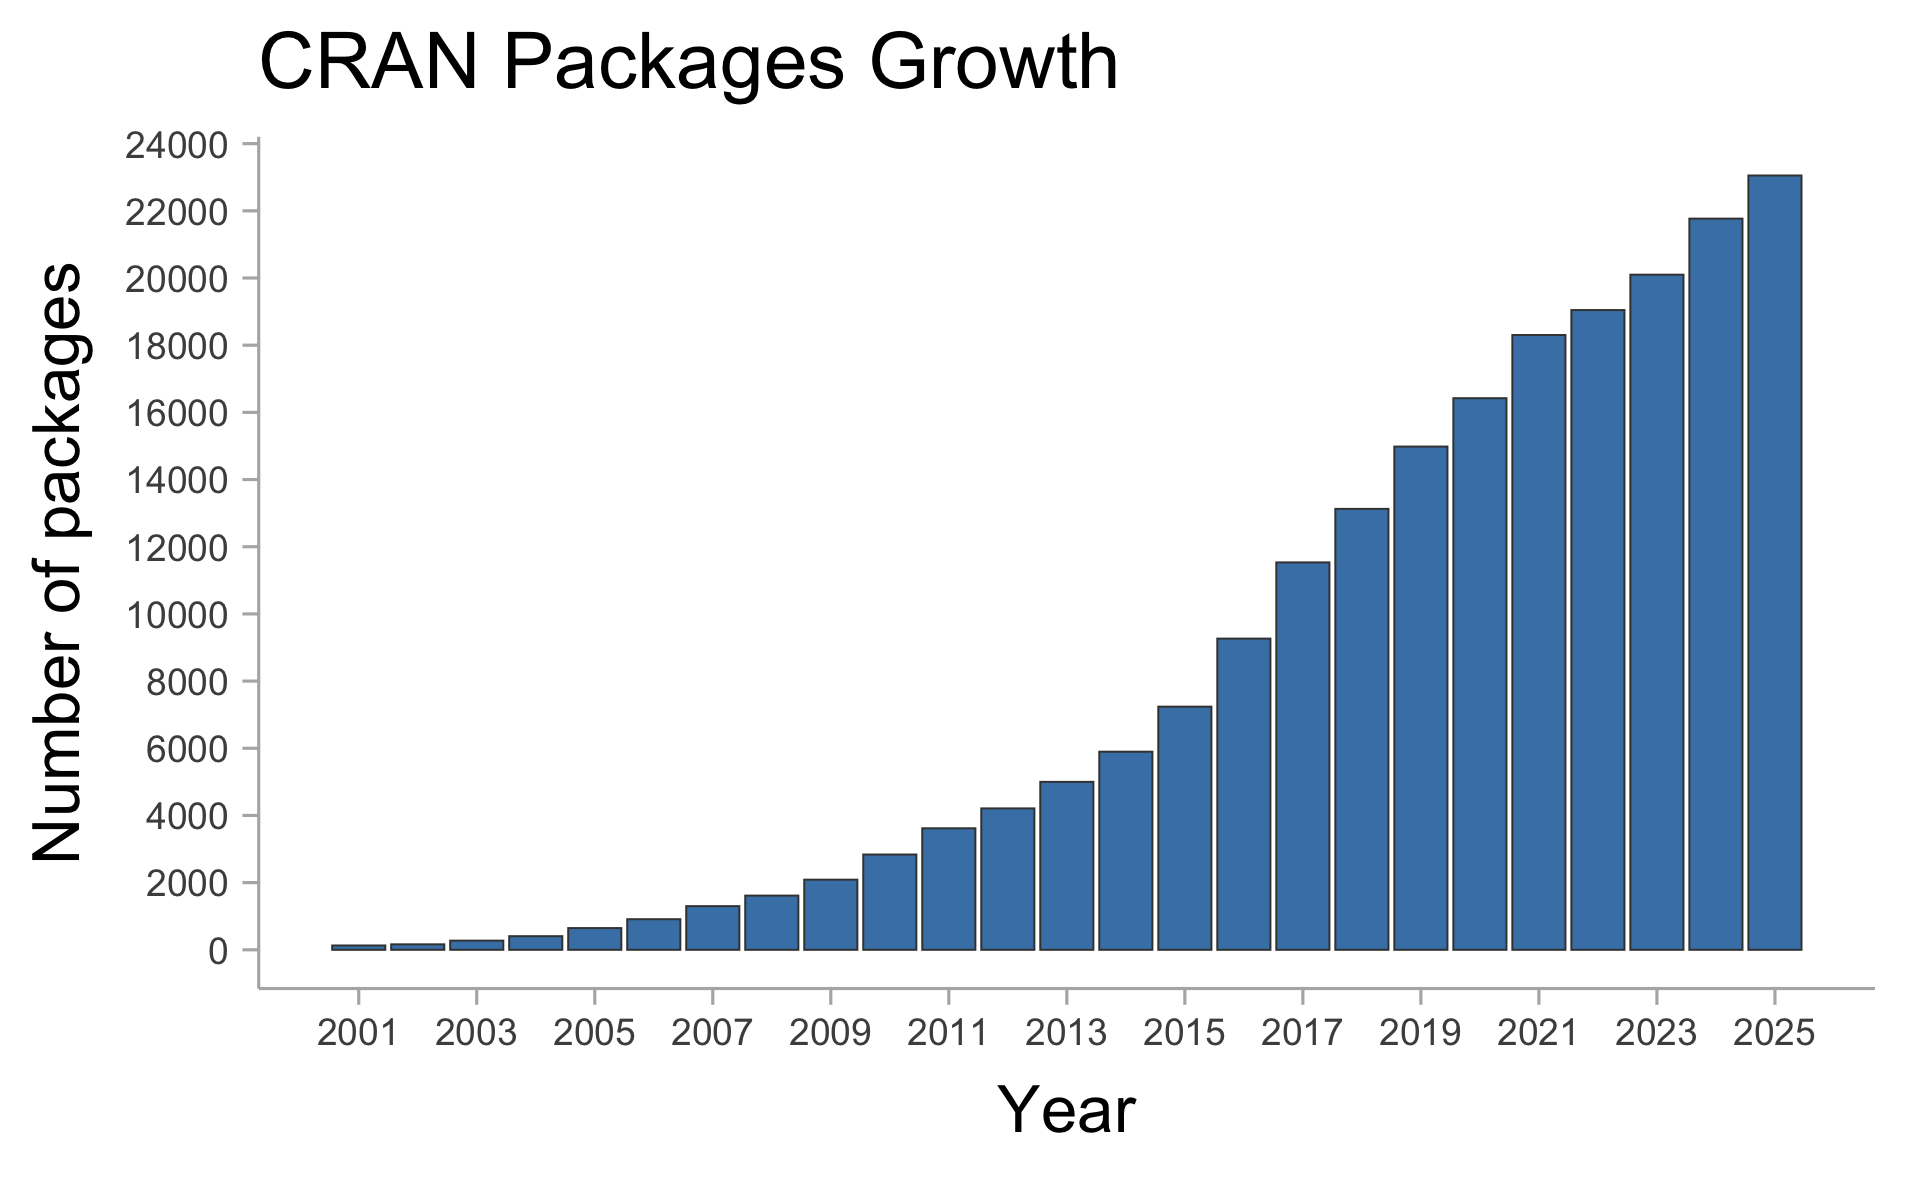
Packages
There are currently 23,052 of packages (on CRAN only).
R vs. Excel for Data Wrangling 📊
- Excel: Known for ease of use, popular among business and finance professionals.
- Pros: Intuitive, good for small datasets and quick analysis.
- Cons: Limited in handling large datasets, lacks reproducibility.
- R: Provides powerful data manipulation packages (e.g.,
dplyr,tidyr).- Pros: Handles large datasets efficiently, supports complex transformations, fully reproducible.
- Cons: Requires programming knowledge, steeper learning curve than Excel.

Tip
- Tip: R is highly scalable and is ideal for projects requiring automation, reproducibility, and handling large datasets.
R vs. SAS for Statistical Analysis 📉
- SAS: A powerful statistical software suite used widely in industries such as healthcare and finance.
- Pros: Robust for regulatory environments, highly standardized.
- Cons: Proprietary and costly, limited community contributions.
- R: Offers a vast array of statistical packages and flexibility in method implementation.
- Pros: Free and open-source, customizable, strong community support.
- Cons: Requires more coding and configuration for regulatory standards.

Note
- Comparison: R is often chosen for research and academia due to its flexibility and customization, while SAS remains strong in industries needing strict compliance and control.
R vs Python 🔍
- R, & Python are popular languages in data science and research.
- Each language has unique strengths, ideal use cases, and licensing considerations.
![]()
![]()
R: Strengths and Use Cases 🧮
- Designed for Statistics: R is optimized for statistical analysis, making it ideal for research and academia.
- Visualization: Excellent data visualization libraries like
ggplot2. - Licensing: Licensed under GPL; many packages are also GPL, with some using MIT or BSD.
Ideal Use Cases:
- Data analysis, visualization, and complex statistical modeling.
- Research and academia where open-source, reproducible code is needed.
- Licensing in Production: GPL may restrict proprietary use; check package licenses carefully.
![]()
Python: Strengths and Use Cases 🐍
- General-Purpose Language: Python is popular for both data science and software development.
- Machine Learning & AI: Extensive libraries for ML and AI, such as
scikit-learn,TensorFlow. - Licensing: PSFL (Python Software Foundation License), highly permissive for proprietary use.
Ideal Use Cases:
- End-to-end development, from data wrangling to ML and web development.
- Production-ready ML and AI applications.
- Licensing in Production: Permissive licenses allow closed-source use, making Python production-friendly.
![]()
Why R?
- 1. Open-Source
- Free to use and modify, with contributions from a large community.
- 2. Multi-Platform
- Runs on Windows, macOS, and Linux, making it versatile for collaboration.
- 3. Community Support
- Strong online help through forums, tutorials, and dedicated resources.
- 4. Continuous Development
- Regular updates keep R on the leading edge of data science.
- 5. Reproducible Workflows
- Tools like Rmarkdown and Quarto facilitates the job.
![]()
Why RStudio?
- 1. An interface to R
- Provides a user-friendly environment to work with R.
- 2. Integrates various components of an analysis
- Combines data, code, and output in one place, simplifying the workflow.
- 3. Colored syntax
- Highlights code with colors, making it easier to read and spot errors, improving code clarity.
- 4. Syntax suggestions
- Offers autocomplete suggestions, which speeds up coding and reduces mistakes.
- 5. RStudio panels
- Panels for console, scripts, files, and plots, giving quick access to all elements.
![]()
Rstudio panels

Why posit cloud?
- 1. Learn how to use a cloud service
- Gain experience with cloud-based tools, increasingly important in data science.
- 2. Access from anywhere
- Access R and RStudio directly from your web browser without any setup.
- 3. Collaboration
- Share projects easily with others, facilitating teamwork and joint analysis.
- 4. It’s free for you
- You’ll have free access to Posit Cloud through this course (this semester).
Why version control? 🔄
- 1. Track Changes
- Maintain a complete history of edits, making it easy to identify when and why changes were made.
- 2. Collaborate Seamlessly
- Multiple users can work together without overwriting each other’s work, enhancing teamwork.
- 3. Ensure Data Integrity
- Protect primary data by using branches for experimentation, avoiding accidental overwrites.
- 4. Boost Reproducibility
- Access exact versions of code and data, enabling others to reproduce your work reliably.
- 5. Provide Built-in Documentation
- Changes can be documented, helping to understand workflow.
![]()
![]()
What are Git and GitHub?
- Git
- A version control system that tracks changes in files on your local computer, allowing you to manage versions and revert to previous work.
- GitHub
- An online platform for hosting Git repositories, enabling easy collaboration, project sharing, and cloud storage.
![]()
![]()
THANK YOU!
_
Adrian A. Correndo
📬 acorrend@uoguelph.ca
Assistant Professor
Pick Family Chair, Sustainable Cropping Systems
Rm 226, Crop Science Building

Contact me
 |
||
 |