Reproducible Data Science with R III
R Packages Essentials
2025-11-28
Example 1: mutate()
![]()
Packages like dplyr simplify tasks by providing clean, concise code for data manipulation.
1. Create a new column: total, which is the sum of two existing columns (var1 and var2).
Example 1: mutate()
![]()
Base R version
Example 2: filter()
![]()
2. Filtering: get values of var1 greater than 2.
Example 3: select()
![]()
3. Select specific variables: get var1 and var3.
Example 4: iteration
![]()
Scenario: You have a data frame with a column study and a column data, where data contains nested data frames for each study.
We want to fit a linear model to each nested data frame (predicting y by x) and store the models in a new column called model.
Example 4: iteration
![]()
Base R version (for loop)
Where do packages come from ❓

![]()
![]()

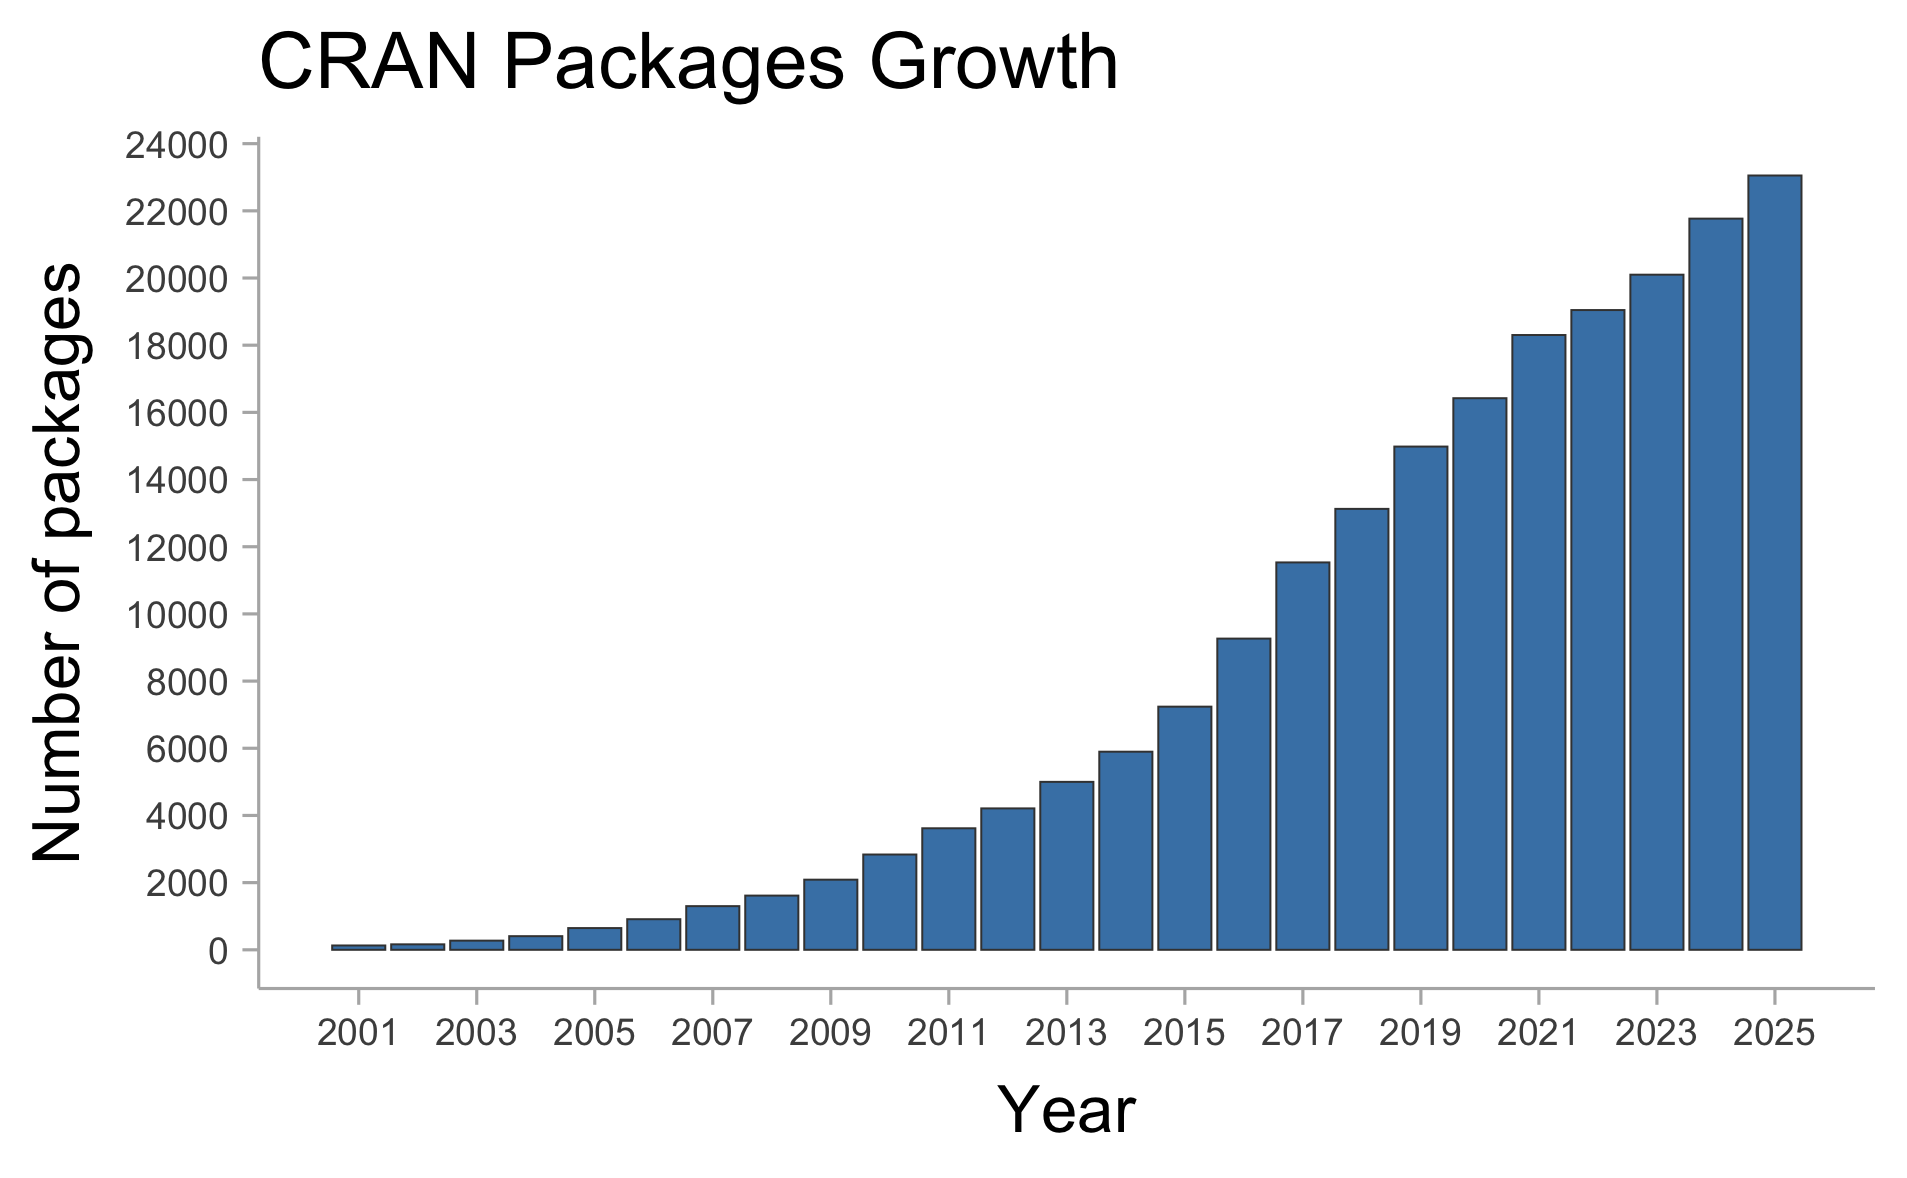
CRAN: Comprehensive R Archive Network 🗂️
There are currently +23,000 of packages (on CRAN only).
Agriculture Task View
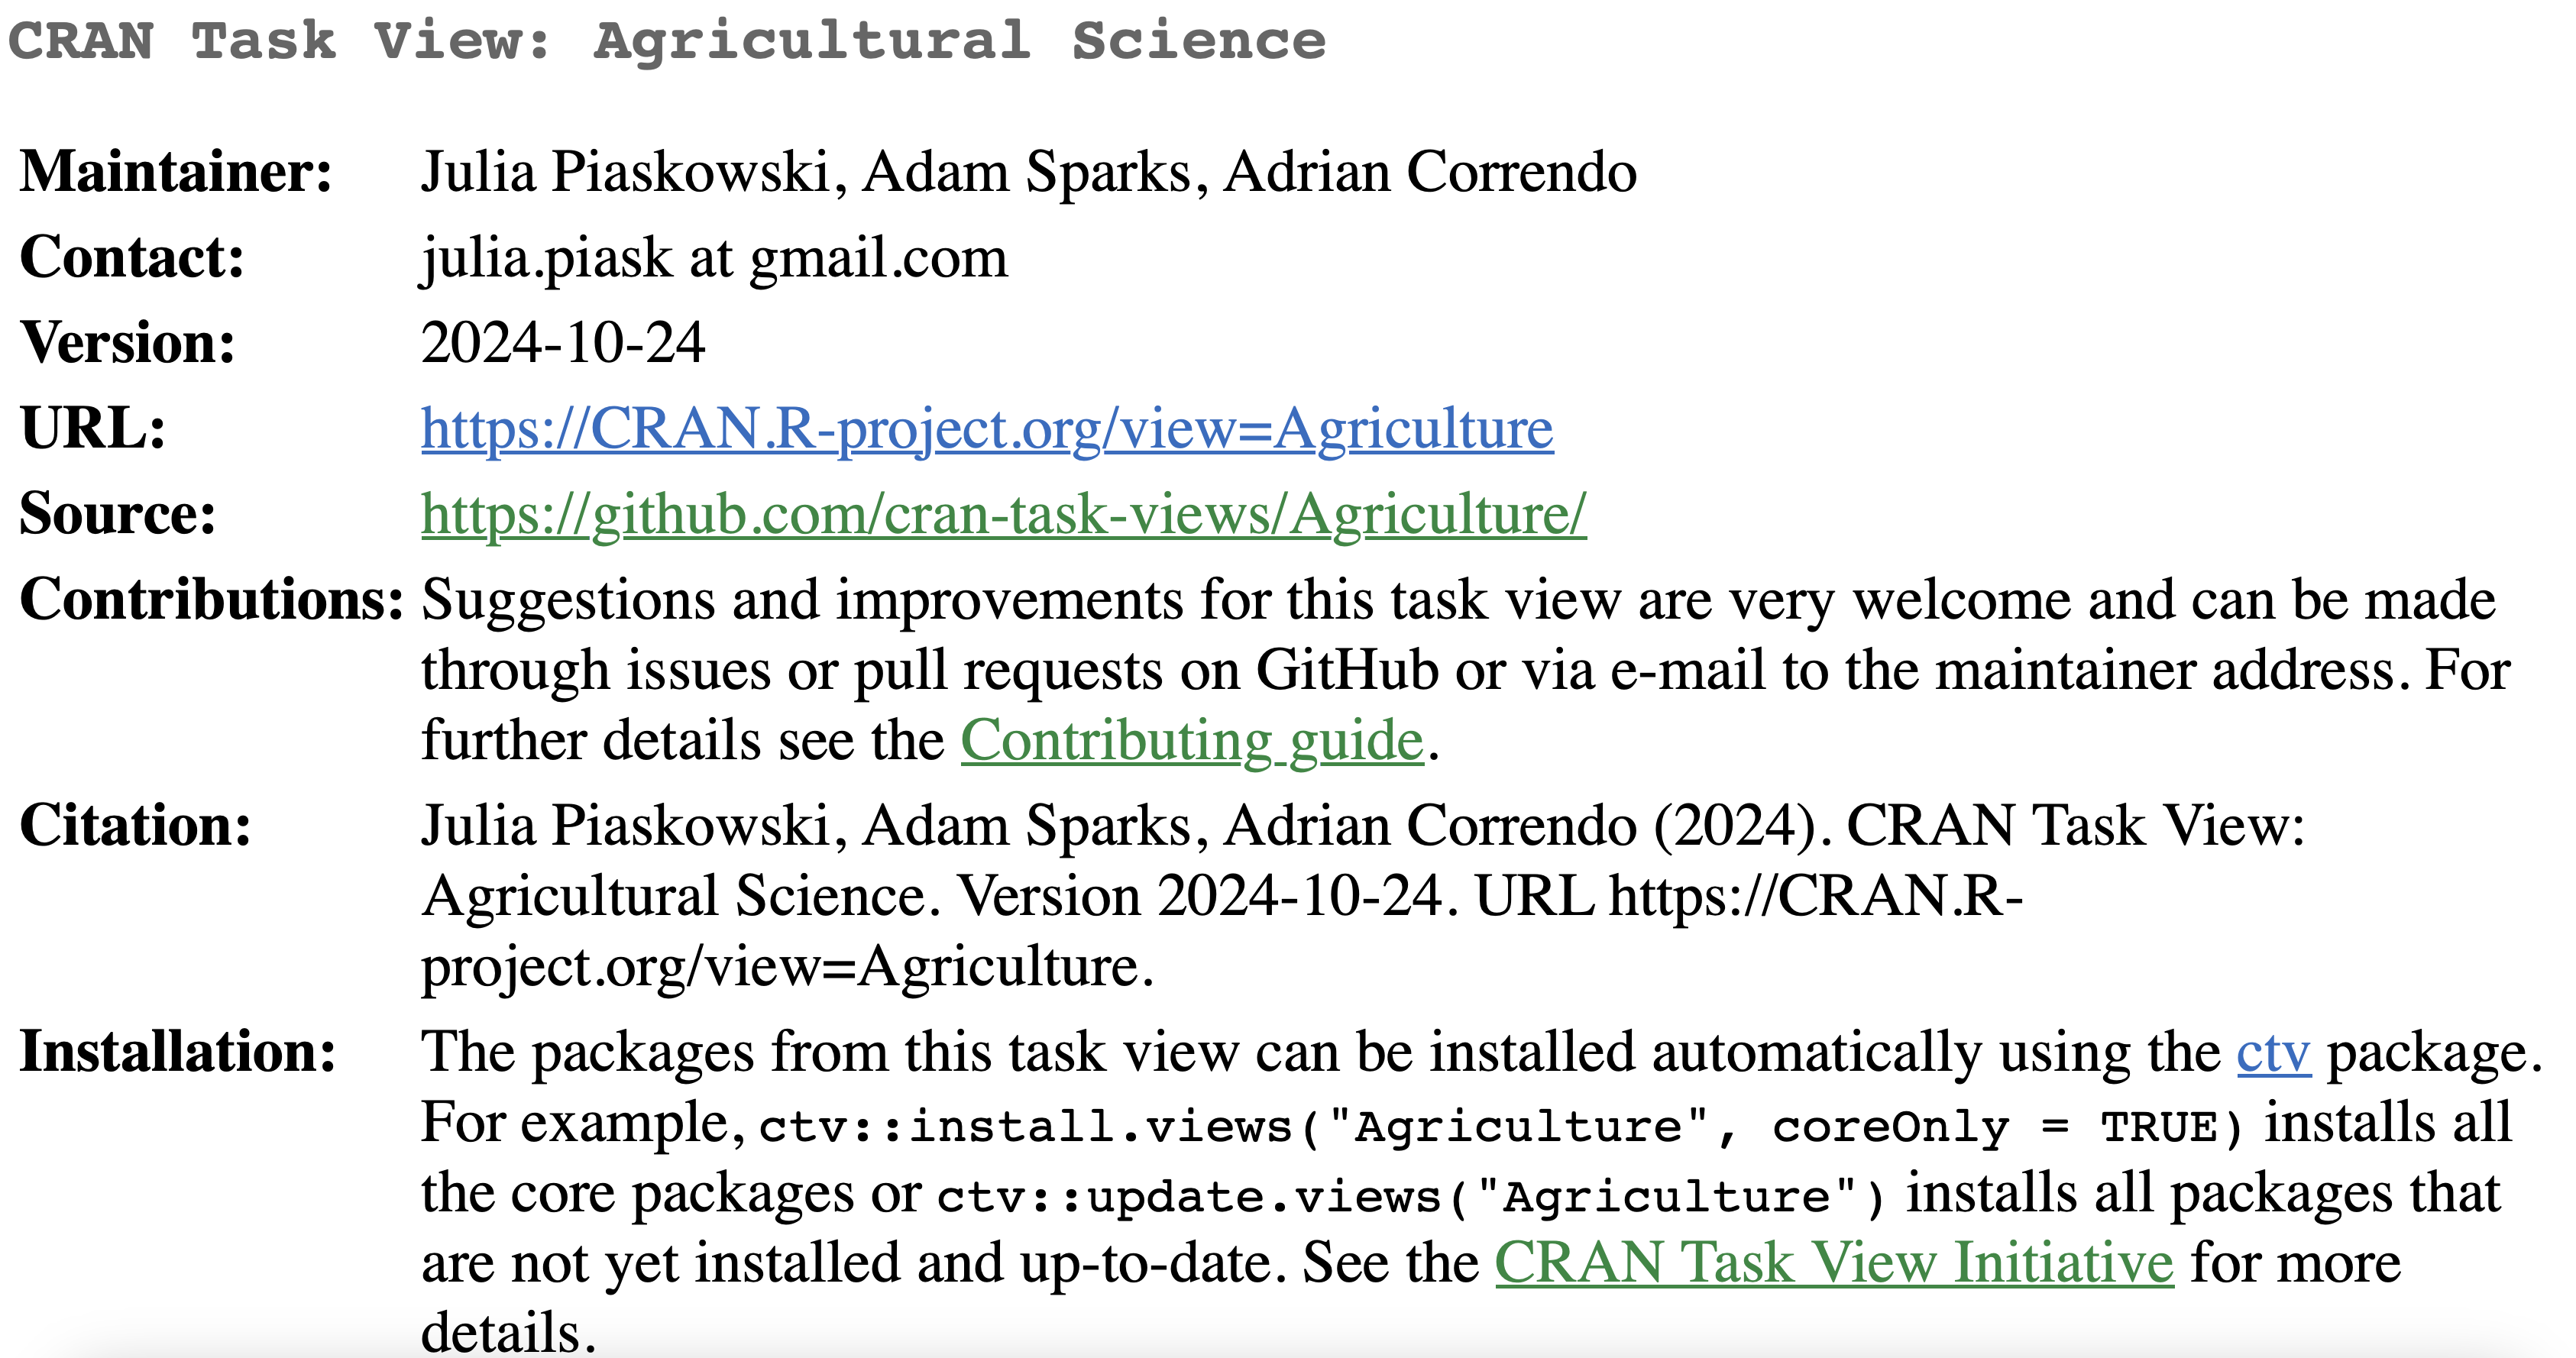
It compiles R packages useful for agricultural research and data analysis.
- Content Includes:
- Packages for analyzing crop and livestock data.
- Tools for spatial analysis of agricultural data.
- Resources for agricultural economics and statistical models.
- Examples of Included Packages:
- agricolae: Provides tools for analysis of experimental data in agriculture.
- agridat: A collection of agricultural datasets for research and teaching.
- Why Use It?
- Simplifies the search for agricultural tools.
- Helps researchers quickly identify relevant resources for their work.
Package from GitHub
![]()
A platform that allows developers to share packages with fewer restrictions, encouraging innovation and collaboration.
Pros 🚀
- Cutting-edge features and fast updates
- Flexible release of experimental tools or features
- Community-driven contributions and improvements
Cons ⚠️
- Less stability
- Potential for bugs and security risks
- Requires manual dependency management
- Variable documentation quality
Bioconductor
![]()
A platform designed for bioinformatics and computational biology, providing tools for genomic and biomedical data.
Pros 🚀
- Tailored for Bioinformatics: Ideal for handling specialized data
THANK YOU!
acorrend@uoguelph.ca Adrian A. Correndo
Assistant Professor
Sustainable Cropping Systems
Department of Plant Agriculture
University of Guelph
Rm 226, Crop Science Bldg | Department of Plant Agriculture Ontario Agricultural College | University of Guelph | 50 Stone Rd E, Guelph, ON-N1G 2W1, Canada.
Contact me
 |
||
 |