It creates a confusion matrix table or plot displaying the agreement between the observed and the predicted classes by the model.
Arguments
- data
(Optional) argument to call an existing data frame containing the data.
- obs
Vector with observed values (character or factor).
- pred
Vector with predicted values (character or factor).
- plot
Logical operator (TRUE/FALSE) that controls the output as a
data.frame(plot = FALSE) or as a plot of typeggplot(plot = TRUE), Default: FALSE- unit
String (text) indicating the type of unit ("count" or "proportion") to show in the confusion matrix, Default: 'count'
- colors
Vector or list with two colors indicating how to paint the gradient between "low" and "high", Default: c(low = NULL, high = NULL) uses the standard blue gradient of ggplot2.
- print_metrics
boolean TRUE/FALSE to embed metrics in the plot. Default is FALSE.
- metrics_list
vector or list of selected metrics to print on the plot. Default: c("accuracy", "precision", "recall").
- position_metrics
string specifying the position to print the performance
metrics_list. Options are "top" (as a subtitle) or "bottom" (as a caption). Default: "bottom".- na.rm
Logic argument to remove rows with missing values (NA). Default is na.rm = TRUE.
Details
A confusion matrix is a method for summarizing the predictive performance of a classification algorithm. It is particularly useful if you have an unbalanced number of observations belonging to each class or if you have a multinomial dataset (more than two classes in your dataset. A confusion matrix can give you a good hint about the types of errors that your model is making. See online-documentation
References
Ting K.M. (2017). Confusion Matrix. In: Sammut C., Webb G.I. (eds) Encyclopedia of Machine Learning and Data Mining. Springer, Boston, MA. doi:10.1007/978-1-4899-7687-1_50
Examples
# \donttest{
set.seed(183)
# Two-class
binomial_case <- data.frame(labels = sample(c("True","False"), 100, replace = TRUE),
predictions = sample(c("True","False"), 100, replace = TRUE))
# Multi-class
multinomial_case <- data.frame(labels = sample(c("Red","Blue", "Green"), 100,
replace = TRUE), predictions = sample(c("Red","Blue", "Green"), 100, replace = TRUE))
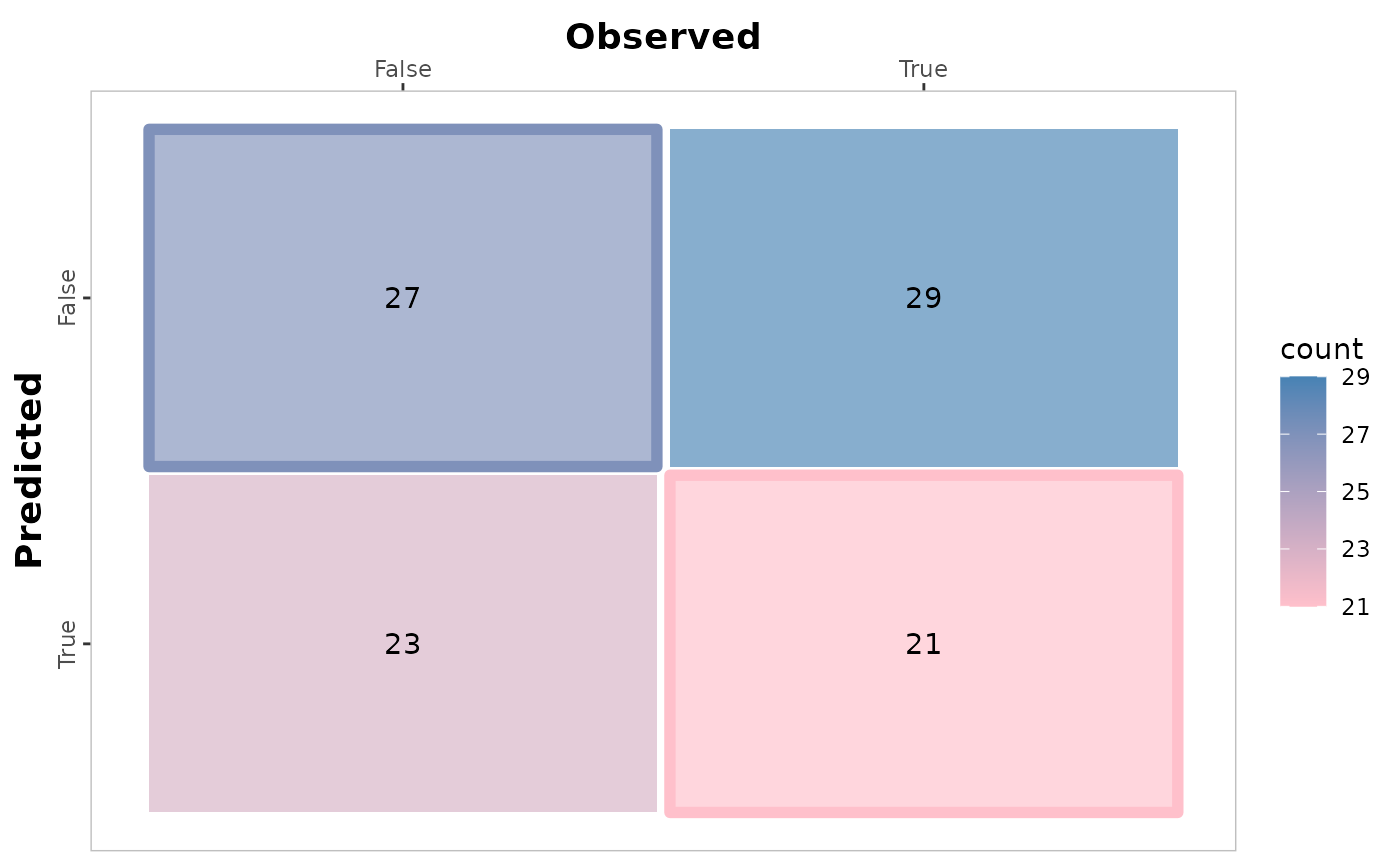
# Plot two-class confusion matrix
confusion_matrix(data = binomial_case, obs = labels, pred = predictions,
plot = TRUE, colors = c(low="pink" , high="steelblue"), unit = "count")
#> Warning: Using linewidth for a discrete variable is not advised.
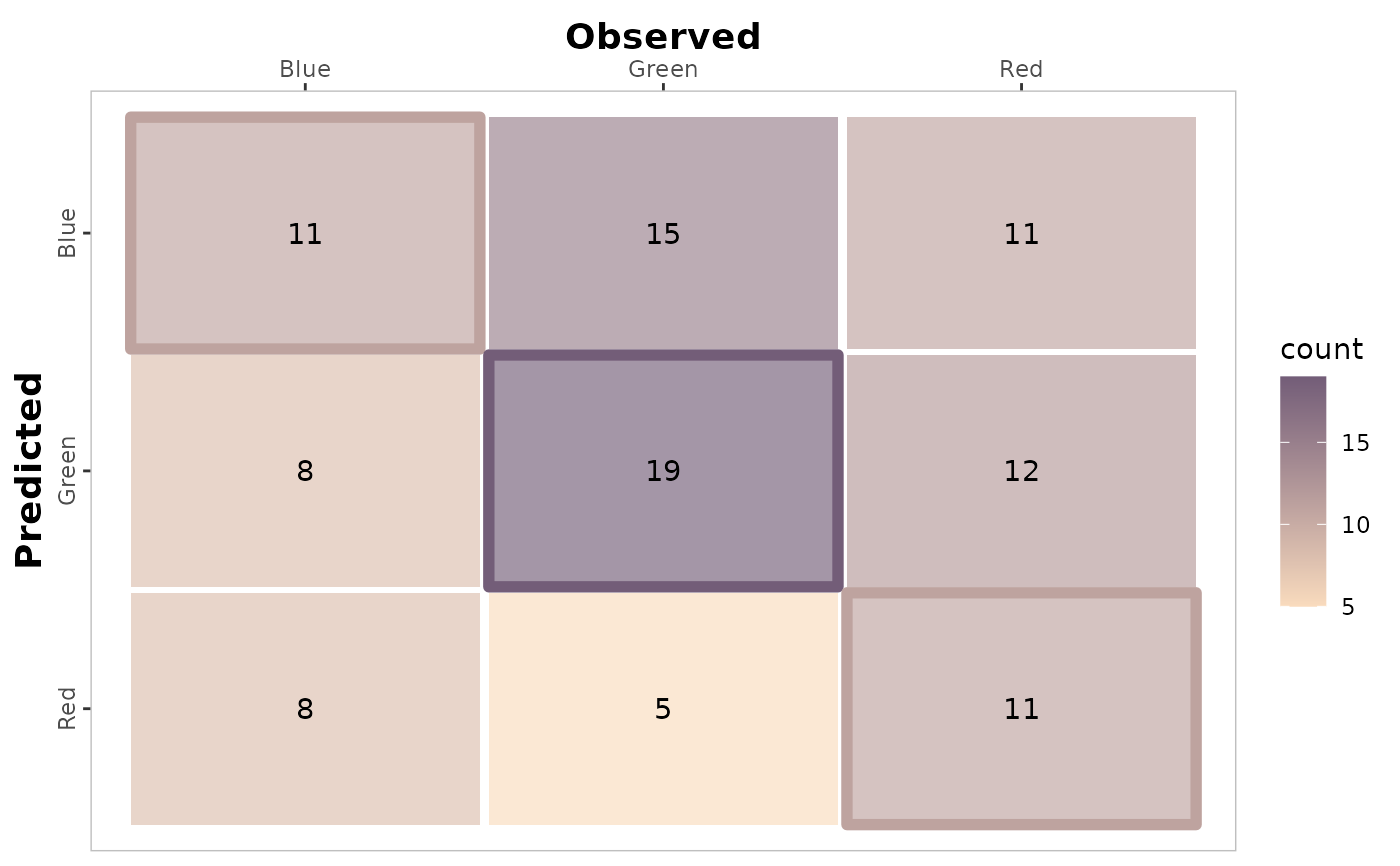
 # Plot multi-class confusion matrix
confusion_matrix(data = multinomial_case, obs = labels, pred = predictions,
plot = TRUE, colors = c(low="#f9dbbd" , high="#735d78"), unit = "count")
#> Warning: Using linewidth for a discrete variable is not advised.
# Plot multi-class confusion matrix
confusion_matrix(data = multinomial_case, obs = labels, pred = predictions,
plot = TRUE, colors = c(low="#f9dbbd" , high="#735d78"), unit = "count")
#> Warning: Using linewidth for a discrete variable is not advised.
 # }
# }